Abstract
Imagine that a biologist arrived at your big family reunion and had no idea who were sisters, cousins, aunts, uncles, etc., but tried to sort it out by how all of you look. Just based on how you look, would s/he be able to guess whether the kid standing next to you is your sister or your cousin? The biologist might be able to make some good guesses this way, but by using samples of your family's DNA, s/he could construct your whole family tree. In this project, you'll use a Web-based computer program to help make a "human family tree." (For a more advanced project, see The Tree of Life – II (advanced).)Summary
Author: Shelley Force Aldred, Department of Genetics, Stanford University
Editor: Ken Hess
Objective
The goal of this project is to use a computer program on the Web to compare a DNA sequence from several human genes with the corresponding genes in other animals. This will allow us to infer how closely related we are to those animals. This is easier than you think, and this project is good preparation for more advanced experiments you might want to do later in your studies.Introduction
Think about or draw out your family tree adding aunts, uncles, and cousins. The tree could look like the tree in Figure 1 (except that you would fill in the names of your relatives.) If you don't have siblings or cousins just draw a big family tree from your imagination. Based on your family tree, you can see that you are more closely related to your sister (or brother) than you are to your cousin; that is there are fewer "branches" separating you from your sister than there are separating you and your cousin.
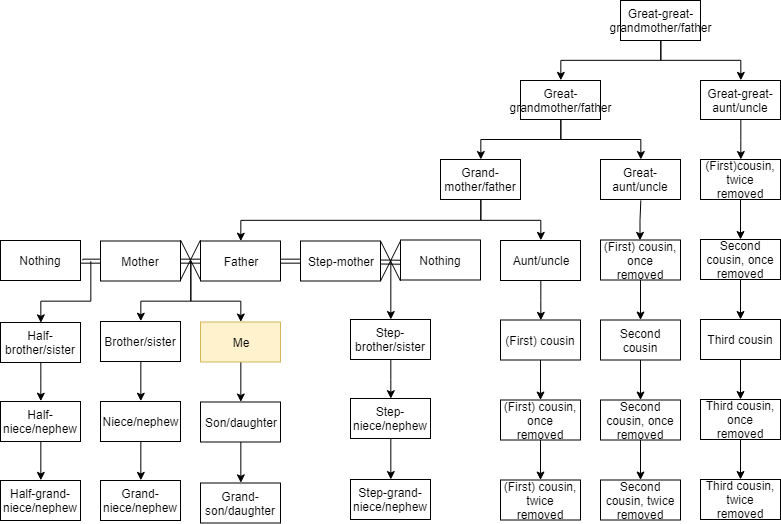 Image Credit: Wikimedia Commons, Olegispe / Creative Commons Attribution-Share Alike 4.0 International lic
Figure 1. Example family tree. (Wikimedia, Author Olegispe, CC BY-SA)
Now imagine that a biologist arrived at a big family reunion and had no idea who were sisters, cousins, aunts, uncles, etc. but tried to sort it out by how all of you look. Just based on how you look, would s/he be able to guess which of the two kids standing next to you is your sister and which is your cousin? In many families, the biologist may be able to make a pretty good guess based on your visible features (called your morphology), like number of arms/legs/eyes, hair color, nose shape, etc. (Notice that some of these morphological features are shared by all humans but that other features can be used to distinguish you from one another.) But this is not a fail-safe approach to determining familial relationships—as some people look more like their cousin than their sister, right? You could just use morphology to make a good guess.
So what is the best way to determine how related you are to one another (besides just asking -- but stick with me here)? The biologist would have to look at your DNA! You get half of your DNA from your mother and half from your father. Both of those "halves" are very similar to one another—with one difference about every 1000 base pairs (but out of three billion total letters—that's three million differences!). And your mother and father got their DNA from their parents and so on up the family tree. Your DNA should be MUCH more similar to your sister's than your cousin's because you and your sister both got your DNA from the same parents, whereas there are many more branches in the tree (and thus many more matings and DNA base pair differences entering the tree) between you and your cousin. That is, you are much more similar genetically to your sister because you have more recent common ancestors than you and your cousin.
Family Trees In Biology
So how does all of this apply to biology? For centuries, scientists have been trying to draw the family tree that reflects the history and evolution of all animals on the earth. This tree would show which species are more closely related to one another, like the case where you are "closer" to your sister on your family tree than you are to your cousin. For example, humans are more closely related to chimpanzees than to dolphins, so chimps and humans would have fewer branches between them on the "animal family tree."
How do scientists make this family tree? For many years, scientists relied on comparisons of morphological characteristics (like hair, teeth, limbs, fins, hearts, livers, eyes, etc.) to try to figure out who was more closely related to whom. These kinds of comparisons are often accurate, but as you saw in the example of a human family, these physical characteristics can sometimes be misleading. Evidence of this concept is that different scientists would come up with different trees/relationships by using different sets of morphological information! So which tree is "right?"
To think about how to identify the "right" tree, we have to think about how these animals became different from one another throughout evolution. All heritable morphological changes (those changes that can be passed down to the next generation) are a result of changes (mutations) in an organism's DNA. This mutation can lead to a change in a protein sequence or a change in when, where or how much of the protein gets made. That's it! One or a couple of these changes can lead to big a difference in morphology and/or the way a single cell in the organism can function. So over billions of years of evolution, a slow accumulation of DNA sequence (and thus some protein sequence) changes has led to the existence of all of the earth's different species—with some more closely related to one another than others. This whole process is called molecular evolution.
So, as we saw with the family reunion example, the best way to see how related two organisms are is to compare their DNA or protein sequences. (Remember that a protein's sequence is encoded in its gene's DNA - so the only way to get a protein sequence change is to get a change in the DNA that codes for it.) Those organisms with the most similar DNA/protein sequence are almost surely more closely related than those with less similar DNA/protein sequences.
Why didn't scientists use DNA sequences to build the trees 100 years ago? First, it has only been about 50 years since the discovery that DNA is actually the genetic material that gets passed on through generations. Second, DNA and protein sequencing technologies have only recently gotten efficient enough that DNA/protein sequence data is available from many different kinds of animals. With all of this new information, scientists are working hard to build the "true" animal family tree. And there have been cases where the tree built using DNA sequence data differs from those built using morphological data! (Can you explain for your project why DNA sequence is the "gold standard" for determining relatedness between animals?)
Note: Even though sequence comparison is the gold standard, it is not perfect. Sometimes comparisons of different proteins will yield different trees. Which one is right? Why might this happen?
Terms and Concepts
- DNA, gene
- DNA sequence (a, t, g, c)
- mRNA
- Protein, translation
- Sequence/protein/molecular evolution
- Homolog/homology
- Sequence alignment
Bibliography
- NIH. (n.d.). About Genomics. National Human Genome Research Institute. Retrieved September 2, 2021.
- PBS. (n.d.). Evolution. Retrieved September 2, 2021.
Materials and Equipment
- Computer with Internet access
- Lab notebook
Experimental Procedure
Below on this page we have copied partial DNA sequences from four different genes, and for each one we have included the human version as well as the same gene for several other animals. For each gene you should make a hypothesis about which animal is most closely related to humans, then use the computer program described below to analyze the DNA sequence to see if your hypothesis was correct.
For example, "Gene 1" below on this page is for humans as well as several different ape species. Humans are very closely related to ape species. Which of these apes do you think is most closely related to humans? Orangutan, chimpanzee, or gorilla? Why do you think this is the case? (Based on how they look? Which parts helped you decide? Nose shape, arm length, amount of hair?) Make your hypothesis, then follow these steps:
- Go to the NCBI website. (If you click this link we'll open it in another browser window, that way you can still see these instructions.)
- Click on the BLAST link in the "Popular Resources" list on the right to get to the BLAST page. BLAST stands for Basic Local Alignment Search Tool. It is a powerful Web-based tool for sequence alignment. It has several features, but we will use it to compare two genes, showing us where the genes are similar and where they are different. You can watch the video below to learn more about the BLAST tool.
- The computer will now display a page with general information about BLAST. Scroll down to the "Specialized searches" section. Click on "Global Align (Compare two sequences across their entire span (Needleman-Wunsch))."
- On the next page, you will see two boxes, in which you can enter the two sequences that you want to compare (Figure 2). Leave all the numbers and settings at their default values.
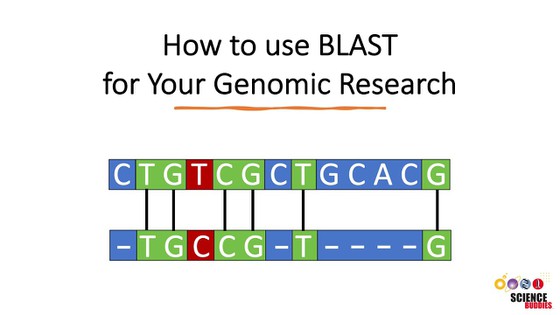
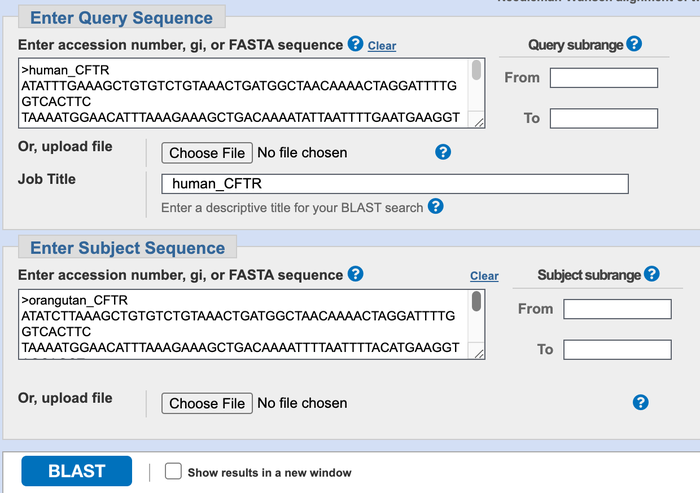 Image Credit: NCBI
Figure 2. BLAST two sequence alignment input page. Your query page should look similar to this one after you have filled it in with the two sequences.
- From the genes displayed lower on this page, copy and paste the sequence you wish to compare the other sequences to (the human sequence) into the upper blank box that says "Enter Query Sequence". A sequence looks like this, with a ">" symbol and gene name on the first line with several lines of letters underneath. This way of writing out a DNA sequence is called the FASTA format:
>human_XYZ7
ATATTTGAAAGCTGTGTCTGTAAACTGATGGCTAACAAAACTAG
GATTTTGGTCACTTCTAAAATGGAACATTTAAAGAAAGCTGACA
[Don't use this sample, it's just an example!] - Copy and paste the second sequence to compare into the blank box where it says "Enter Subject Sequence". Then click on the button that says "BLAST."
- For your first trial, use the ">human_CFTR" (be sure to include all the 729 letters in the sequence below) as Query Sequence and ">orangutan_CFTR" (with its 729 letters) as the Subject Sequence.
- It's very important to use your computer's copy and paste ability for putting your sequences into BLAST. It would be almost impossible to accurately type all those letters one-by-one!
- The computer will display "BLAST Results." The BLAST output page should look similar to Figure 3. On the top left of the BLAST results page you will find the summary section (blue in Figure 3), which provides information on different aspects of your search. On the top right there is a box that allows you to filter your results based on certain criteria (red in Figure 3). Below the top section, the BLAST results are shown (yellow in Figure 3). There are four different tabs called "Description," Graphic Summary," "Alignments," and "Taxonomy." Each tab presents the search results in a different way.
- The "Description" tab contains a summary table of hits found by BLAST and is the default tab shown. For this science project, the list will only show the subject sequence that you put into your alignment search.
- The "Graphic Summary" tab shows a color key of the alignments. The color key shows the degree of similarity for the sequences.
- The "Alignment" section contains the detailed pairwise alignment between the query and subject sequence.
- The "Taxonomy" section provides details of the taxonomic distribution of matches BLAST found.
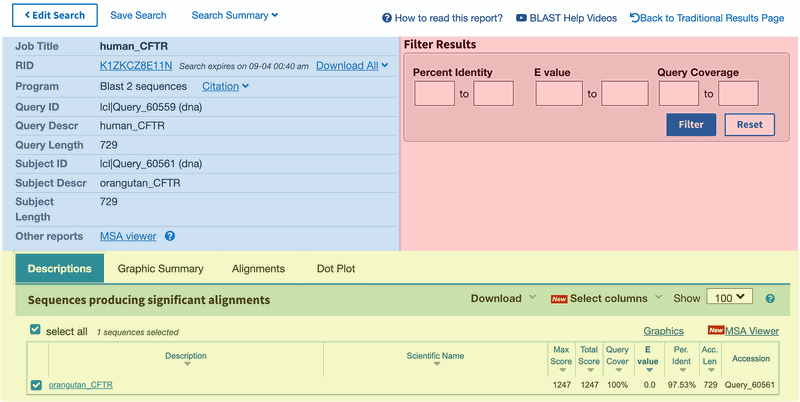 Image Credit: NCBI
Figure 3. Snapshot of the BLAST outout page for the two sequence alignment search.
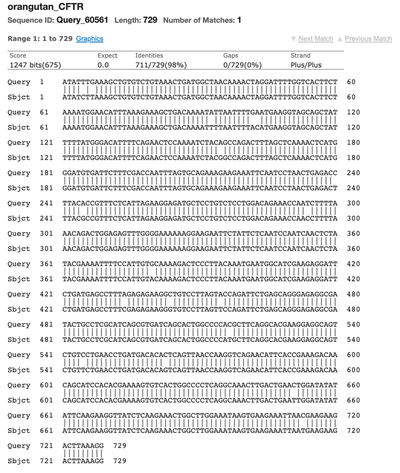
- Click on the "Alignment" tab to look at the alignment of your two sequences (Figure 4).
- The top row of letters (labeled "Query") corresponds to the sequence you pasted into the "Query Sequence" box. The bottom row of letters (labeled "Sbjct" or "Subject") corresponds to the sequence you pasted into the "Subject Sequence" box. Where the bases/letters at a particular position are the same (e.g. "A" in both sequences at position 1), a vertical line will connect the two lines of letters. Where there is a mismatch (e.g. a "T" at position 5 in the Query Sequence and a "C" at position 5 in the Subject Sequence), the letters will NOT be connected by a vertical line.
- Note the "Identities" value, which is the percent of bases/letters that are the same in the query and the subject sequence. If the % identity between two sequences is 97%, then these two sequences differ by 3% in their nucleotide sequence. Remember, the larger the % difference, the more distant they are in the family tree.
 Image Credit: NCBI
Figure 4. A detailed view of the two aligned sequences as shown in the "Alignment" tab of the BLAST output page.
- For your data analysis, use BLAST to compare the human gene to the one for each animal: human vs. orangutan, human vs. chimp, human vs. gorilla. Count up the # of differences between each of the test species and human (as a raw number and a fraction/percentage of the total). The species with the fewest differences between itself and human is likely to be the most closely related to humans.
- How does the data fit with your hypothesis? What did you learn about using morphology vs. sequence comparison to infer evolutionary relationships?
- Do the same analysis on the other three genes below. Keep in mind that in this experiment you must compare similar genes to get meaningful results. If you compare a pig sequence for gene BMP7 and a gorilla gene CFTR, you'll get garbage output (but you won't hurt anything)!
Gene 1
Here is a partial DNA sequence from humans, chimp, gorilla, and orangutan for the Cystic Fibrosis gene (CFTR). In the body this gene's product is involved in making sure mucous doesn't build up in the lungs and that the pancreas secretes the right enzymes to help you digest your food. If this gene is damaged, a patient gets Cystic Fibrosis. Since all of the animals listed have lungs and a pancreas, it makes sense they would have a similar CFTR gene sequence that would provide a similar function.
There should be 729 bases/letters for each sequence.
>human_CFTR
ATATTTGAAAGCTGTGTCTGTAAACTGATGGCTAACAAAACTAGGATTTTGGTCACTTC
TAAAATGGAACATTTAAAGAAAGCTGACAAAATATTAATTTTGAATGAAGGTAGCAGCT
ATTTTTATGGGACATTTTCAGAACTCCAAAATCTACAGCCAGACTTTAGCTCAAAACTC
ATGGGATGTGATTCTTTCGACCAATTTAGTGCAGAAAGAAGAAATTCAATCCTAACTGA
GACCTTACACCGTTTCTCATTAGAAGGAGATGCTCCTGTCTCCTGGACAGAAACCAATC
TTTTAAACAGACTGGAGAGTTTGGGGAAAAAAGGAAGAATTCTATTCTCAATCCAATCA
ACTCTATACGAAAATTTTCCATTGTGCAAAAGACTCCCTTACAAATGAATGGCATCGAA
GAGGATTCTGATGAGCCTTTAGAGAGAAGGCTGTCCTTAGTACCAGATTCTGAGCAGGG
AGAGGCGATACTGCCTCGCATCAGCGTGATCAGCACTGGCCCCACGCTTCAGGCACGAA
GGAGGCAGTCTGTCCTGAACCTGATGACACACTCAGTTAACCAAGGTCAGAACATTCAC
CGAAAGACAACAGCATCCACACGAAAAGTGTCACTGGCCCCTCAGGCAAACTTGACTGA
ACTGGATATATATTCAAGAAGGTTATCTCAAGAAACTGGCTTGGAAATAAGTGAAGAAA
TTAACGAAGAAGACTTAAAGG
>orangutan_CFTR
ATATCTTAAAGCTGTGTCTGTAAACTGATGGCTAACAAAACTAGGATTTTGGTCACTTC
TAAAATGGAACATTTAAAGAAAGCTGACAAAATTTTAATTTTACATGAAGGTAGCAGCT
ATTTTTATGGGACATTTTCAGAACTCCAAAATCTACGGCCAGACTTTAGCTCAAAACTC
ATGGGATGTGATTCTTTCGACCAATTTAGTGCAGAAAGAAGAAATTCAATCCTAACTGA
GACTTTACGCCGTTTCTCATTAGAAGGAGATGCTCCTGTCTCCTGGACAGAAACCAACC
TTTTAAACAGACTGGAGAGTTTGGGGAAAAAAGGAAGAATTCTATTCTCAATCCAATCA
ACTCTATACGAAAATTTTCCATTGTACAAAAGACTCCCTTACAAATGAATGGCATCGAA
GAGGATTCTGATGAGCCTTTCGAGAGAAGGGTGTCCTTAGTTCCAGATTCTGAGCAGGG
AGAGGCGATACTGCCTCGCATCAGCGTGATCAGCACTGGCCCCATGCTTCAGGCACGAA
GGAGGCAGTCTGTTCTGAACCTGATGACACAGTCAGTTAACCAAGGTCAGAACATTCAC
CGAAAGACAACAGCATCCACACGAAAAGTGTCACTGGCCCCTCAGGCAAACTTGACTGA
ATTGGATATATATTCAAGAAGGTTATCTCAAGAAACTGGCTTGGAAATAAGTGAAGAAA
TTAATGAAGAAGACTTAAAGG
>chimpanzee_CFTR
ATATTTGAAAGCTGTGTCTGTAAACTGATGGCTAACAAAACTAGGATTTTGGTCACTTC
TAAAATGGAACATTTAAAGAAAGCTGACAAAATATTAATTTTGCATGAAGGTAGCAGCT
ATTTTTATGGGACATTTTCAGAACTCCAAAATCTACGGCCAGACTTTAGCTCAAAACTC
ATGGGATGTGATTCTTTCGACCAATTTAGTGCAGAAAGAAGAAATTCAATCCTAACTGA
GACCTTACGCCGTTTCTCATTAGAAGGAGATGCTCCTGTCTCCTGGACAGAAACCAATC
TTTTAAACAGACTGGAGAGTTTGGGGAAAAAAGGAAGAATTCTATTCTCAATCCAATCA
ACTCTATACGAAAATTTTCCATTGTGCAAAAGACTCCCTTACAAATGAATGGCATCGAA
GAGGATTCTGATGAGCCTTTAGAGAGAAGGCTGTCCTTAGTACCAGATTCTGAGCAGGG
AGAGGCGATACTGCCTCGCATCAGCGTGATCAGCACTGGCCCCACGCTTCAGGCACGAA
GGAGGCAGTCTGTTCTGAACCTGATGACACACTCAGTTAACCAAGGTCAGAACATTCAC
CGAAAGACAACAGCATCCACACGAAAAGTGTCACTGGCCCCTCAGGCAAACTTGACTGA
ACTGGATATATATTCAAGAAGGTTATCTCAAGAAACTGGCTTGGAAATAAGTGAAGAAA
TTAACGAAGAAGACTTAAAGG
>gorilla_CFTR
ATATCTTAAAGCTGTGTCTGTAAACTGATGGCTAACAAAACTAGGATTTTGGTCACTTC
TAAAATGGAACATTTAAAGAAAGCTGACAAAATATTAATTTTGCATGAAGGTAGCAGCT
ATTTTTATGGGACATTTTCAGAACTCCAAAATCTACGGCCAGACTTTAGCTCAAAACTC
ATGGGATGTGATTCTTTCGACCAATTTAGTGCAGAAAGAAGAAATTCAATCCTAACTGA
GACCTTACGCCGTTTCTCATTAGAAGGAGATGCTCCTGTCTCCTGGACAGAAACCAATC
TTTTAAACAGACTGGAGAGTTTGGGGAAAAAAGGAAGAATTCTATTCTCAATCCAATCA
ACTCTATACGAAAATTTTCCATTGTACAAAAGACTCCCTTACAAATGAATGGCATCGAA
GAGGATTCTGATGAGCCTTTAGAGAGAAGGCTGTCCTTAGTACCAGATTCTGAGCAGGG
AGAGGCGATACTGCCTCGCATCAGCGTGATCAGCACTGGCCCCACGCTTCAGGCACGAA
GGAGGCAGTCTGTTCTGAACCTGATGACACACTCAGTTAACCAAGGTCAGAACATTCAC
CGAAAGACAACAGCATCCACACGAAAAGTGTCACTGGCCCCTCAGGCAAACTTGACTGA
ACTGGATATATATTCAAGAAGGTTATCTCAAGAAACTGGCTTGGAAATAAGTGAAGAAA
TTAACGAAGAAGACTTAAAGG
Gene 2
Here is a partial DNA sequence from humans, pig, rabbit, and sheep for the Bone Morphogenetic Protein 7 gene (BMP7). Bone Morphogenetic Proteins represent signals found in the body that help induce bone growth.
There should be 196 bases/letters for each sequence.
>human_BMP7
AGAACCGCTCCAAGACGCCCAAGAACCAGGAAGCCCTGCGGATGGCCAACGTGGCAGAG
AACAGCAGCAGCGACCAGAGGCAGGCCTGTAAGAAGCACGAGCTGTATGTCAGCTTCCG
AGACCTGGGCTGGCAGGACTGGATCATCGCGCCTGAAGGCTACGCCGCCTACTACTGTG
AGGGGGAGTGTGCCTTCCC
>pig_BMP7
AGAACCGCTCCAAGACGCCCAAGAACCAGGAAGCCCTGCGGGTGGCCAACGTCGCAGAG
AACAGCAGCAGTGACCAGCGGCAGGCCTGTAAGAAGCATGAGCTCTACGTCAGCTTCCG
GGACCTGGGCTGGCAAGACTGGATCATCGCGCCCGAAGGCTATGCCGCCTACTACTGCG
AGGGGGAGTGCGCCTTCCC
>rabbit_BMP7
AGAACCGCTCCAAGGCACCCAAGAACCAAGAGGCGCTGCGAGTGGCCAACGTGGCAGAA
AACAGCAGCAGTGACCAGCGGCAGGCGTGCAAGAAACACGAACTGTACGTCAGCTTCCG
CGACCTGGGCTGGCAGGATTGGATCATTGCCCCGGAAGGCTACGCCGCCTACTACTGCG
AGGGAGAGTGCGCCTTCCC
>sheep_BMP7
AGAATCGCTCCAAGGCGCCCAAGAACCAAGAAGCCCTGCGGGTGGCCAACGTCGCAGAA
AACAGCAGCAGTGACCAGAGGCAGGCATGTAAGAAGCACGAGCTATACGTCAGCTTCCG
GGACCTGGGCTGGCAGGATTGGATCATCGCACCCGAAGGCTATGCCGCCTACTACTGCG
AGGGGGAGTGCGCCTTCCC
Gene 3
Here is a partial DNA sequence from humans, cow, dog, and horse for Leptin (LEP), a signal found in the body that tells your brain how much fat you have stored away. Leptin may help regulate how hungry you feel.
There should be 426 bases/letters for each sequence.
>human_LEPTIN
TGTGGCTTTGGCCCTATCTTTTCTATGTCCAAGCTGTGCCCATCCAAAAAGTCCAAGAT
GACACCAAAACCCTCATCAAGACAATTGTCACCAGGATCAATGACATTTCACACACGCA
GTCAGTCTCCTCCAAACAGAAAGTCACCGGTTTGGACTTCATTCCTGGGCTCCACCCCA
TCCTGACCTTATCCAAGATGGACCAGACACTGGCAGTCTACCAACAGATCCTCACCAGT
ATGCCTTCCAGAAACGTGATCCAAATATCCAACGACCTGGAGAACCTCCGGGATCTTCT
TCACGTGCTGGCCTTCTCTAAGAGCTGCCACTTGCCCTGGGCCAGTGGCCTGGAGACCT
TGGACAGCCTGGGGGGTGTCCTGGAAGCTTCAGGCTACTCCACAGAGGTGGTGGCCCTG
AGCAGGCTGCAGG
>cow_LEPTIN
TGTGGCTTTGGCCCTATCTGTCTTACGTGGAGGCTGTGCCCATCCGCAAGGTCCAGGAT
GACACCAAAACCCTCATTAAGACAATTGTCACCAGGATCAATGACATCTCACACACGCA
GTCCGTCTCCTCCAAACAGAGGGTCACTGGTTTGGACTTCATCCCTGGGCTCCACCCTC
TCCTGAGTTTGTCCAAGATGGACCAGACATTGGCGATCTACCAACAGATCCTCACCAGT
CTGCCTTCCAGAAATGTGGTCCAAATATCCAATGACCTGGAGAACCTCCGGGACCTTCT
CCACCTGCTGGCCGCCTCCAAGAGCTGCCCCTTGCCGCAGGTCAGGGCCCTGGAGAGCT
TGGAGAGCTTGGGCGTTGTCCTGGAAGCTTCCCTCTACTCCACCGAGGTGGTGGCCCTG
AGCCGGCTGCAGG
>dog_LEPTIN
TGTGGCTCTGGCCCTATCTGTCCTGTGTTGAAGCTGTGCCAATCCGAAAAGTCCAGGAC
GACACCAAACCCCTCATCAAGACGATTGTCGCCAGGATCAATGACATTTCACACACTCA
GTCTGTCTCCTCCCAACAGAGGGTCGCTGGTCTGGACTTCATTCCTGGGCTCCAACCAG
TCCTGAGTTTGTCCAGGATGGGCCAGACGTTGGCCATATACCAACAGATCCTCAACAGT
CTGCATTCCAGAAATGTGGTCCAAATATCTAATGACCTGGAGAACCTCCGGGACCTTCT
CCACCTGCTGGCCTCCTCCAAGAGCTGCCCCTTGCCCCGGGCCAGGGGCCTGGAGACCT
TTGAGAGCGTGGGCGGCGTCCTGGAAGCCTCACTCTACTCCACAGAAGTGGTGGCTCTG
AACAGACTGCAGG
>horse_LEPTIN
TGTGGCTTTGGCCCTATCTGTTCTTCATTGAAGCTGTGCCCATCCGAAAAGTCCAGGAT
GACACCAAAACCCTCATCAAGACGATTGTCACCAGGATCAATGACATTTCACACACGCA
GTCAGTCTCCTCCAAACAGAGGGTCACTGGTTTGGACTTCATTCCTGGGCTTCACCCTG
TCCTGAGTTTGTCCAAGATGGACCAGACATTGGCAATCTACCAACAGATCCTTACAAGT
CTGCCTTCCAGAAATGTGATCCAGATATCTAATGACCTGGAGAACCTCCGGGACCTTCT
CCACCTGCTGGCCTCCTCCAAGAGTTGCCCCTTGCCCCAGGCCAGGGGTCTGGAGACCT
TGGCGAGCCTGGGCGGTGTCCTGGAAGCTTCACTCTACTCCACAGAGGTGGTAGCCCTG
AGCAGGCTGCAGG
Gene 4
Here is a partial DNA sequence from humans, mouse, and rat for Opsin1 (OPS1MW) Opsins are involved in providing color vision in the eye. Changes in the function of an opsin protein can lead to color-blindness.
There should be 776 bases/letters for each sequence.
>human_OPSIN
CCCTTCGAAGGCCCGAATTACCACATCGCTCCCAGATGGGTGTACCACCTCACCAGTGT
CTGGATGATCTTTGTGGTCATTGCATCCGTTTTCACAAATGGGCTTGTGCTGGCGGCCA
CCATGAAGTTCAAGAAGCTGCGCCACCCGCTGAACTGGATCCTGGTGAACCTGGCGGTC
GCTGACCTGGCAGAGACCGTCATCGCCAGCACTATCAGCGTTGTGAACCAGGTCTATGG
CTACTTCGTGCTGGGCCACCCTATGTGTGTCCTGGAGGGCTACACCGTCTCCCTGTGTG
GGATCACAGGTCTCTGGTCTCTGGCCATCATTTCCTGGGAGAGATGGATGGTGGTCTGC
AAGCCCTTTGGCAATGTGAGATTTGATGCCAAGCTGGCCATCGTGGGCATTGCCTTCTC
CTGGATCTGGGCTGCTGTGTGGACAGCCCCGCCCATCTTTGGTTGGAGCAGGTACTGGC
CCCACGGCCTGAAGACTTCATGCGGCCCAGACGTGTTCAGCGGCAGCTCGTACCCCGGG
GTGCAGTCTTACATGATTGTCCTCATGGTCACCTGCTGCATCACCCCACTCAGCATCAT
CGTGCTCTGCTACCTCCAAGTGTGGCTGGCCATCCGAGCGGTGGCAAAGCAGCAGAAAG
AGTCTGAATCCACCCAGAAGGCAGAGAAGGAAGTGACGCGCATGGTGGTGGTGATGGTC
CTGGCATTCTGCTTCTGCTGGGGACCATACGCCTTCTTCGCATGCTTTGCTGCTGCCAA
CCCTGGCTA
>mouse_OPSIN
CCCTTTGAAGGCCCCAATTATCACATTGCTCCCAGGTGGGTGTACCACCTCACCAGCAC
CTGGATGATTCTTGTGGTCGTTGCATCTGTCTTCACTAATGGACTTGTGCTGGCAGCCA
CCATGAGATTCAAGAAGCTGCGCCATCCACTGAACTGGATTCTGGTGAACTTGGCAGTT
GCTGACCTAGCAGAGACCATTATTGCCAGCACTATCAGTGTTGTGAACCAAATCTATGG
CTACTTCGTTCTGGGACACCCTCTGTGTGTCATTGAAGGCTACATTGTCTCATTGTGTG
GAATCACAGGCCTCTGGTCCCTGGCCATCATTTCCTGGGAGAGATGGCTGGTGGTCTGC
AAGCCCTTTGGCAATGTGAGATTTGATGCTAAGCTGGCCACTGTGGGAATCGTCTTCTC
CTGGGTCTGGGCTGCTATATGGACGGCCCCACCAATCTTTGGTTGGAGCAGGTACTGGC
CTTATGGCCTGAAGACATCCTGTGGCCCAGACGTGTTCAGCGGTACCTCGTACCCCGGG
GTTCAGTCTTATATGATGGTCCTCATGGTCACGTGCTGCATCTTCCCACTCAGCATCAT
CGTGCTCTGCTACCTCCAAGTGTGGCTGGCCATCCGAGCAGTGGCAAAGCAACAGAAAG
AATCTGAGTCCACTCAGAAGGCCGAGAAGGAGGTGACACGCATGGTGGTGGTGATGGTC
TTCGCATACTGCCTCTGCTGGGGACCCTATACTTTCTTTGCATGCTTTGCTACTGCCCA
CCCTGGCTA
>rat_OPSIN
CCCTTTGAAGGTCCCAATTATCACATTGCTCCAAGGTGGGTGTACCACCTCACCAGCAC
CTGGATGATTCTTGTGGTCATTGCATCTGTCTTCACAAATGGACTCGTGCTGGCAGCCA
CCATGAGGTTCAAGAAGCTGCGTCATCCTCTGAACTGGATTCTAGTGAACTTGGCAGTT
GCTGACCTAGCAGAGACCATTATTGCCAGCACTATCAGTGTTGTGAACCAAATCTATGG
CTACTTTGTGCTGGGCCACCCTCTGTGTGTCATAGAAGGCTACATTGTCTCACTATGTG
GGATCACAGGCCTCTGGTCCTTGGCCATCATTTCCTGGGAGAGATGGCTGGTGGTCTGC
AAGCCCTTTGGCAATGTGAGATTTGATGCTAAACTGGCCACTGTGGGAATCGTCTTCTC
CTGGGTCTGGGCTGCTGTATGGACGGCCCCACCAATCTTTGGTTGGAGCAGGTACTGGC
CTTATGGCCTGAAGACATCGTGTGGTCCAGACGTGTTCAGCGGTACCTCGTATCCTGGG
GTTCAGTCTTATATGATGGTCCTCATGGTCACGTGCTGCATCTTCCCACTCAGCATCAT
CGTGCTCTGCTACCTCCAAGTGTGGCTGGCCATCCGAGCAGTGGCAAAGCAACAGAAAG
AATCTGAGTCCACCCAGAAGGCTGAGAAGGAGGTGACACGCATGGTGGTGGTGATGGTC
TTCGCATACTGCCTCTGCTGGGGGCCCTATACTTTCTTTGCATGCTTTGCTACTGCCCA
TCCTGGCTA
Ask an Expert
Global Connections
The United Nations Sustainable Development Goals (UNSDGs) are a blueprint to achieve a better and more sustainable future for all.

Variations
You can also use a multiple sequence alignment program (like T-Coffee or CLUSTAL W) instead of BLAST to do a "multiple sequence alignment," comparing sequences from multiple species all at one time. Your input file should be a list of FASTA formatted sequences representing the same gene in different organisms (the same format as the genes above).
Here are two multiple sequence (DNA/RNA/protein) alignment tools:
Careers
If you like this project, you might enjoy exploring these related careers:


