Abstract
Social media is all the buzz on the internet. What can we do with all the information generated by millions of people posting, tweeting, taking pictures, and chatting? How do companies convert it into profit? While you do not have the tools to analyze data from millions of social media posts by yourself, you will be able to analyze a scaled-down version. Follow the instructions in this project to try your hand at extracting data from a couple of social media sites and use it to create meaningful visualizations (i.e. representations or pictures of the data) with the goal of gaining interesting insights about social media use.Summary

Objective
Use data extracted from social media to study the number of posts about a real-world event during and after the event.Introduction

Are you the one people turn to for the buzz? Are you interested in trends? Do you like to stay informed on what people are talking about? Maybe you are interested in fashion or in popular cars, sports, celebrities, music, or video games. Whatever the subject, it is not an easy task to stay up-to-date on what is going on in the quickly changing world around you. Trends in social media messages like tweets, Facebook posts, and YouTube videos are similarly hard to stay up on. Following just a couple of posts on a social media site will not give you much of a big-picture view about who is posting, what they are posting about, and when they post. However, looking at a large set of social media posts can reveal trends and insights in habits, fashion, and other things that are of interest to us. This project will allow you to look at how a real-world event affects the number of posts about that event over time. Figure 1 shows an example where social media posts about tennis player Serena Williams were followed over a three-day period, starting on the day of a big tennis match. Other ideas for studies you can perform with the data collected in this project can be found in the Variations.
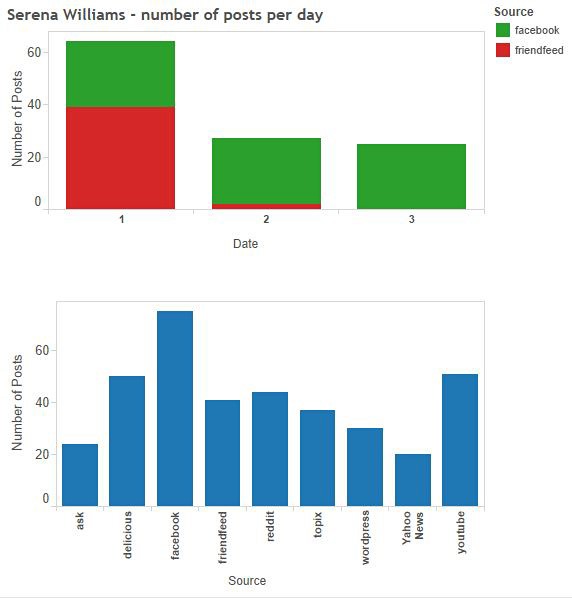 Image Credit: Sabine De Brabandere, Science Buddies / Science Buddies
The top bar chart graphs the number of posts per day that mention Serena Williams over three days. It is also color coded to differentiate between posts on Facebook and FriendFeed. On day 1 which is when the event occurred, FriendFeed makes up the majority of the posts in a day. Days 2 and 3 consist almost entirely of Facebook posts which seem to remain consistent in the number of posts per day through all 3 days. The second bar chart on the bottom graphs posts per day across 9 different social media sites, with Facebook, YouTube, and Delicious having the majority of the posts.
Figure 1. Number of social media posts about one specific topic (tennis player Serena Williams) over a three-day period, starting with the day of an important tennis match.
Are you wondering why extracting information hidden in social media posts is such big business? Marketing and publicity can definitely put the collected data to profitable use! Think of advertisements tailored to the interests and hobbies of the consumer. Trends in social media help target customers efficiently. Companies and political parties use social media to influence the public opinion by peer reviews, informative videos, and posts forwarded from one person to the next. Trends help choose the social media provider that will suit the goal, they allow a user to set the right timing for a post, or to use the most efficient format and content of a post.
 Image Credit: pixabay.com / CC0 Public Domain –Free for commercial use / No attribution required
Figure 2. Social media provides a new way of marketing.
Many political parties, nonprofit organizations, and small businesses use social media to connect with their clients, but would the information hidden in social media posts be of interest to you? Could it help you spot the social media provider with the most posts on topics you care about and, as such, help you use social media more efficiently? Maybe knowing when and why people post messages can help you stay more up-to-date, more efficiently. The data is out there, so why not give it a try?
Gaining information and insight from the massive amount of social media messages out there is not an easy task. It is considered a "big data" job. How is it big data? First read the Science Buddies What is Big Data?, then consider that social media posts are constantly being created in abundance and include different types of data (pictures, hyperlinks, etcetera) including "messy" data (like text). Do you agree that these two characteristics make extracting valuable information from a massive sample of social media posts a big data job? In this science project, you will keep the job manageable by drastically reducing the sample of posts and by studying easy-to-access parameters, like the time a post was created. As we walk you through the process of a big data job fueled by social media posts, think about what you would like to study.
The first step in a big data job is the data collection. Ideally, data scientists know what the data will be used for (the kinds of questions they will study) and can organize the data accordingly. In reality, this is not always possible, because databases might have been created historically, new questions might come up during the analysis, and so on. In this project, you will use a publicly available tool (socialmention) to extract social media posts about a specific topic. It returns a list of publicly available posts containing—among other fields—a time stamp, a hyperlink to the post, and the source and user of the post. This will serve as input for your study.
The original data set—this is the set that has not been processed or manipulated—is often referred to as raw data or primary data.
Once the data is collected, it needs to be processed. For example, the language in a social media message can be processed and tagged to a main topic and a "sentiment" (positive, neutral, or negative tone of the message). This adds metadata or data about the data to the post.
Once the data and metadata is available, we enter the field of data mining. Data mining uses tools like artificial intelligence and modeling to detect patterns and trends in data. It transforms data into information we can understand. It is the potential predictive power of these trends and patterns that is of value. As an example, Science Buddies uses data mining to fuel the Topic Selection Wizard. After filling in a short questionnaire, the wizard presents you with a selection of science projects you would probably enjoy. Peer-reviewed research has shown that students who use this recommender tool are 95% more likely to find a Project Idea that satisfies them, compared with students who simply browse. In other words, the wizard is significantly better at selecting projects you will enjoy than you doing it manually. How can it do this? Data mining on information gathered from thousands of other students allow Science Buddies to extract trends, which, when applied to your input, reveal a good prediction of what you will enjoy.
Now, are you eager to discover some trends? The Procedure will guide you through a study of the frequency of posts (the number of posts per day) related to a certain big event on the days just preceding and following the event, including the day of the event. Once you feel comfortable analyzing social media data, you can try to identify other trends. The suggestions in the Variations can spark more ideas.
Terms and Concepts
- Social media
- Big data
- Raw data
- Primary data
- Metadata
- Data mining
- Hypothesis
- Universal time
- Peak value
Questions
- How do advertisers, political parties, or nonprofit organizations use social media and what information gained from data mining could they use to optimize their social media use?
- What are some examples of social media analysis you think could be done on a typical household computer, and what are some examples you think would need more computer power?
- What are the main steps in a big data project?
Bibliography
- Furnas, A. (2012, April 3). Everything You Wanted to Know About Data Mining but Were Afraid to Ask. The Atlantic. Retrieved February 12, 2015.
- HubSpot. (2014, January 9.) Where marketers go to grow. Retrieved February 15, 2015.
- Hall, Robert J. (n.d.). Finite Math, Module 8: Introduction. Texas A&M University. Retrieved March 4, 2015.
- Hannell, E. (2015, February 27.) Tableau and Twitter with a dash of Python. Retrieved March 13, 2015.
You can download free data visualization software from:
- Tableau Public. (n.d.). Download Tableau Public. Retrieved January 28, 2015.
Materials and Equipment
- Computer for which you have permission to download data
- Data visualization computer program, like Microsoft Excel or Tableau Public
- Lab notebook
Experimental Procedure
Planning Your Study
As mentioned in the Introduction, in order to efficiently collect data, you need to know what you would like to study. In this section, you will familiarize yourself with the data collection for your social media study and form the hypothesis of your study.
The following procedure assumes you are using socialmention—a free social media search engine—to collect data. This tool was chosen because it allows you to download a list of posts without the need to write code. You can use a different tool to collect your data. Suggestions are given in the Variations section. However, you will need to adapt the procedure accordingly if you decide to collect data in a different way.
- Explore socialmention.
- To familiarize yourself with socialmention, do a search on a topic of interest, or click on one of the trending topics suggested by socialmention.
- Take a moment to explore the results page. How many posts did it return? Which social media providers (sources) were accessed to retrieve the posts? Use the drop-down menu at the top of the screen to filter your results to different time frames; for example, the last 12 or 24 hours. Figure 3 can help you find the time window selection box. What happens to the number of posts for the different social media providers? Are you puzzled by the results? Step d. and e., below, will clarify.
- The upper-right corner provides buttons to export the data, as shown in Figure 3. Export the data to a CSV/Excel file and open it on your computer. Look at the information available for each post. The following information will probably be of interest for your project: date-time, source, and user. Do you notice anything unusual?
- A technical note on the date-time might help you understand the data returned by socialmention.
- Not all social media providers provide the data and time stamp in the same way. Some providers present the date and time the post was posted, while others present the date and time it was accessed by the user like socialmention or you. As a result, you might see that quite a few posts (like those from Photobucket) have an identical data-time stamp. This reflects the time the post was retrieved from the provider, not the date and time the post was posted.
- Even the data and time a post was posted can be confusing. In general, the universal time is listed, not the local time shown on the machine where the post was created. Note that the settings of a device (like a computer or tablet) allow you to specify which time zone you would like to use on this device (like Eastern Standard Time, Pacific Standard Time, etcetera). As an example, consider posts following the broadcasting of the soccer World Cup. Say a person in New York on the east coast (using a computer set to follow United States Eastern Standard Time) and a supporter in San Francisco on the west coast (using a computer set to follow United States Pacific Standard Time) both post a message one minute after a goal was made. The time listed for these posts will be exactly the same, being the universal time (e.g. 11:43 pm on Jan 20th). The local time for these two supporters, as displayed on their devices will be different though. The east coast supporter's clock would indicate 5:43 pm and the west coast user reads 2:43 pm local time on his or her device. This difference in local and universal time explains why you might get posts in your list that seem to be in the future.
- Once you start comparing data over several days, you might notice that posts from some providers (like Facebook and Twitter) are only from the last 12 or 24 hours while others (like YouTube) go further back in time. You will need to use this knowledge to get a good sample of data for your analysis.
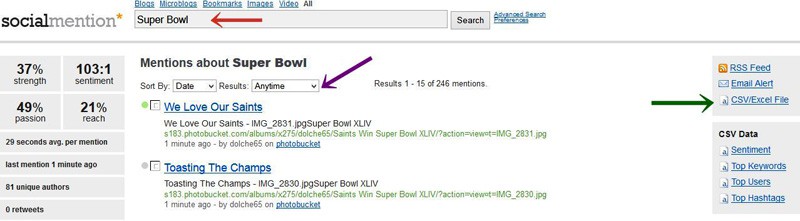 Image Credit: Sabine De Brabandere, Science Buddies / Science Buddies
In SocialMention there is a search bar to find posts that contain keywords, as well as a filtering option to limit the posts to within a certain range of dates. Different websites will provide more or less historical data so that must be taken into account when using the site. After you search, there is an option to export the data gathered into an excel file for further processing.
Figure 3. Socialmention is a free social media search engine. The topic of interest to can be specified in the box indicated by the red arrow. The purple arrow indicates the option to select a time window. To export the search results, look at the tool indicated by the green arrow.
- Now that you know what type of data is available, think of a hypothesis you would like to verify.
- This procedure will study how a real-world event affects the number of posts about that event over time. It will look more closely into Twitter and Facebook. The Variations section provides ideas of other topics you could study. However, you will need to adapt the procedure accordingly if you decide to use a different area of study.
- Formulate a clear hypothesis. Think about a trend you expect to see, and why you expect this trend to be there. Will the number of tweets spike rapidly, while Facebook posts show a wider distribution; or would it be the other way around; or would there barely be a difference? Which information can you use to form an educated guess?
Collecting Data
In this project, you will study the number of posts about an event. As a first step, you need to select a couple of major newsworthy events, like the Super Bowl, a celebrity getting married or passing away, an earthquake, etcetera. You will need at least three events to confirm or reject your hypothesis.
Follow the data-collection procedure below for each event selected.
- Look for a good tag word to capture posts concerning the event selected.
- You need to enter up to a few words that reflect your event in the search box. Looking at the suggested trending topics in socialmention might give you clues on how to choose search words. Try a couple of variations and evaluate the results, taking into account the following considerations:
- You would like to pick up as many posts regarding the event as possible.
- You would like to pick up posts related only to the event and minimize the number of posts unrelated to the event. As an example, "soccer" would be too general to pick up posts related specifically to the World Cup.
- Once you have settled on (a) search word(s), it is important to stick with those search words over the course of your data collection for this event.
- You need to enter up to a few words that reflect your event in the search box. Looking at the suggested trending topics in socialmention might give you clues on how to choose search words. Try a couple of variations and evaluate the results, taking into account the following considerations:
- Collect data over several days around the event.
- If possible, start collecting data at least three days before the event happens (like three days before the soccer World Cup). If you cannot predict the event, start the day of the event (like the day of an earthquake).
- Collect data for at least five days after the day of the event.
- If you can, collect data over a longer period (like 2 weeks before and 2 weeks after the event date). This extended period will give you a more complete view on how the frequency of posts changes over time.
- Try your best to collect data each time at the same time of day (like every day at 5 pm). This will prevent gaps in your data sample.
- For each day you collect data:
- Do a search on the topic on socialmention. Select Last day as the time window. Note that selecting Last Week will not provide data of the past week for all social media providers because, unfortunately, socialmention only looks back at a limited time, like 12 or 24 hours, for particular social media providers like Facebook and Twitter. Staying consistent with your selected time window while collecting data will provide you with a good data sample for analysis.
- Export the data to a CSV/Excel file. This file will later be loaded to the data visualization program of your choice (such as Excel or Tableau Public).
- Save the data to your computer.
- Name your files so the name includes the topic and date, like Soccer-world-cup 2015 02 15. This makes it easy to keep track of the data gathered.
- Clean the data.
- In this process, extraneous information is removed by placing filters when making your distributions (see step 3 in Analyzing the Data below) so only posts from Facebook and Twitter will show. Potential duplicates are taken care of in step 6, below.
- Consolidate the data.
- Gradually merge data from each day, using copy/paste of Excel entries from one file to the other. The result is one big Excel file of consolidated data containing posts posted during a period spanning several days around one event.
- Make sure your data is formatted properly.
- Depending on the data visualization program you are using (such as Excel or Tableau Public), you might have to change the format of the Date/Time field. The "Data" "Text to Columns" tool in Excel can help you split the date from the time for each entry. Consult Excel's "Help" function or do an internet search if you do not know how to do this.
- Note that this project does not look into finer time granularities like hours or minutes. For this project, a day is a nice granularity, allowing you to see a change without getting distracted by fluctuations.
- You can rename column headers if you prefer other variable names for your study.
- Remove any duplicates from the data.
- As you consolidate data gathered at several instances, duplicates (one post occurring several times in your data sample) could have slipped in. You can use the Excel tool to remove duplicates to accomplish a data set that is ready to analyze. Use Excel's "Help" function or do an internet search if you do not know how to do this.
Analyzing the Data
- Create a data table like Table 1 in your lab notebook; it will provide a clear overview of your findings.
| Event 1 | Event 2 | Event 3 | ||||
|---|---|---|---|---|---|---|
| Total number of posts | ||||||
| Number of days with 1 or more posts | ||||||
| Peak value | ||||||
| Width | ||||||
- Use your favorite data visualization program, like Excel or Tableau Public to create visual representations of the data. You will need to create visualizations for each of the three events for which you collected data.
- Create a bar graph showing the number of posts per day, using different colors for the different social media providers. An example is shown in Figure 4.
- Remember that you will only need two colors, as you are comparing two social media providers only. You can do this by placing a filter (in Excel or your favorite data visualization program) on the data to exclude all except the providers you are interested in. Consult the Excel "Help" function or do an internet search if you do not know how to use filters.
- Remember to add a title, label your axes and include a legend to your bar graph.
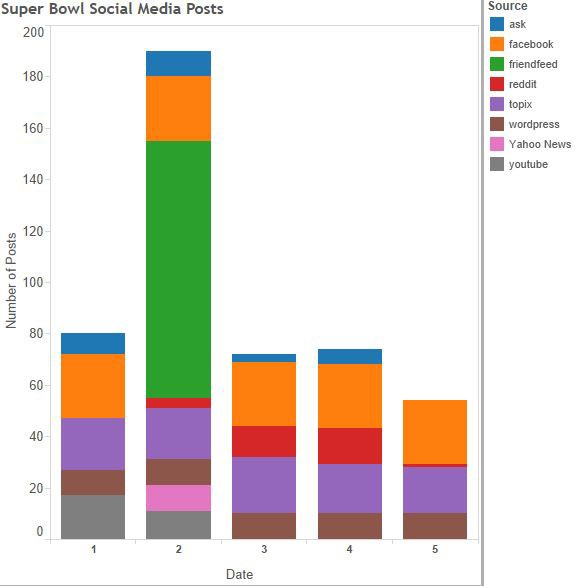 Image Credit: Sabine De Brabandere, Science Buddies / Science Buddies
A stacked bar chart shows the number of posts about Super Bowl XLIX across eight different social media sites. The day before and three days after the event there is about 50-80 posts, while on the day of the event the number of posts jumps to about 190 posts. FriendFeed makes up the majority of the posts on the day of the event.
Figure 4. Bar graph of the number of posts found in eight social media providers about Super Bowl XLIX (a big football game) around the date of the game. The game took place on day 2. Each color represents a different social media provider. The time span has been reduced for this graph.
- Study the distribution for Facebook first. Placing a filter (in whichever data visualization program you are using) or changing the existing filter on the bar graph created in step 3 of this section will help you create a bar graph showing only posts originating from this provider.
- Find the total number of entries in this graph, being the total number of posts for this specific provider over the complete data-collection period.
- Your visualization tool might have an option to see the total number of entries in the graph. If not, a bar graph showing the number of records (posts) per social media provider (source) will inform you about the number of posts for a specific provider.
- Record this number in your table, like Table 1.
- Count the number of days posts were seen for that provider, and record that number in your data table.
- Record the peak value, which is the maximum number of posts seen on a single day.
- Calculate the width of the distribution, defined as the number of days where the number of posts equals or exceeds half of the peak value (including the day with the peak value). A larger width indicates the posts were more spread out over time, whereas a smaller width indicates the posts were concentrated within a short time frame.
- For example, the provider represented in green in Figure 4 shows a peak at day 2, with 100 posts recorded for that day. It has a width of 1, as there is only one day where the number of posts equals or exceeds half of the maximum number of posts, being 50 posts in one single day for that provider.
- The providers represented in orange, purple, and brown would all have a larger width, as the number of posts per day exceeds half of the peak value for each day represented in the bar graph.
- The providers represented in red and blue have a width of 2, as for two days the number of posts on each of those days exceeds half of the number of posts on the peak day.
- Record your findings in a table like Table 1.
- Repeat step 4–9, now looking at Twitter.
- Repeat steps 3–10 for the other two events for which you collected data.
- Look at your data table and bar graphs and try to draw conclusions. The following questions can help you get started:
- Can you see any trends in the total number of posts or the peak number of posts recorded in one single day?
- Are the posts equally spread out over the time during which data was recorded for the two providers studied? Or does one show a sharp peak, while posts are more spread out in time for the other?
- Does the data support or contradict the hypothesis, or is your data inconclusive?
- Identify further areas of study:
- If your events all fall in the same category (like sporting events, entertainment, etcetera), could your data be generalized to other categories (like political events, natural disasters, etcetera)?
- If the bar graphs look very different for the events studied, what could be the source of this difference? Is posting strongly dependent on the type of event?
- What do you think are the differences between a manageable task, like the one presented in this project, and a big data task? Think of what defines big data, as explained in the Introduction, like extracting information from "messy" data (like text), analyzing huge amounts of data, or extracting complicated relationships that ask for large computing power to process.
Ask an Expert
Variations
- In this project, you compared how the number of posts per day is distributed around an event for different social media providers. You could also study if a specific topic (like pop music or sports) is more often discussed in tweets than in Facebook public posts. Or you can study if Twitter users are more likely to post several messages on the same subject within a three-day interval than Facebook users.
- This project involved use of socialmention to extract a list of social media posts. You can also use an application programming interface (often referred to as API) to retrieve data from social media providers or socialmention. APIs are used in a computer program and can facilitate the access of an outside source. Using APIs to collect data has a couple of advantages: cleaning the data could be done automatically by the computer program calling the API, and the data can instantly be stored in the format of your preference; these are just two improvements you could implement. APIs might also make it easy to collect data over a longer period of time. Clicking the link will allow you to access the socialmention API directly. An internet search on "API" and a social media provider will help you locate APIs to access that media provider, and the referenced article in the Bibliography explains how to use an API in Python.
- If you believe the popularity of a public person, record, etcetera, can be measured by the number of social media posts related to that person, record, etcetera, you can measure how popularity changes over time.
- As an alternative, you can create a study to see if particular styles of music are discussed more on a particular social media provider that on another.
Careers
If you like this project, you might enjoy exploring these related careers:


Related Links
- Science Fair Project Guide
- Other Ideas Like This
- Sociology Project Ideas
- Big Data Project Ideas
- My Favorites