Racial and Gender Bias in AI-Generated Images
Abstract
If someone asks you to draw a picture of a doctor, lawyer, or engineer, what first pops into your mind? The race and gender of the person you imagine might be shaped by your personal life experiences, such as whether you have family members in those professions, or what representations of them you have seen on TV or online. What do you think will happen if you ask an artificial intelligence (AI) program to generate the picture instead? Will pictures generated by AI reflect the true real-world racial and gender proportions of those professions? Try this project to find out!
Summary
None
Readily available
No issues
This project is based on Bias in Generative Artificial Intelligence: Evaluating STEM representations in text to image models and the development of a unique measurement tool for generative AI inequality and opportunity by Laila Duggal, Fayetteville Manlius High School. Presented at the Central New York Science and Engineering Fair, Syracuse, NY, April 7th 2024.

Objective
Determine if AI image generation tools over or under-represent certain genders or races when generating pictures of people in different occupations.
Introduction
Generative artificial intelligence can create pictures based on text prompts such as "create a picture of a group of doctors" (Figure 1). Do you notice anything about the image? Only one of the doctors is a woman! However, according to the U.S. Bureau of Labor Statistics (BLS), at the time this image was generated, roughly half of physicians in the US were women. What about the racial or ethnic distribution of the doctors in the photo? Do you think this matches the gender and racial distribution of doctors in the real world?
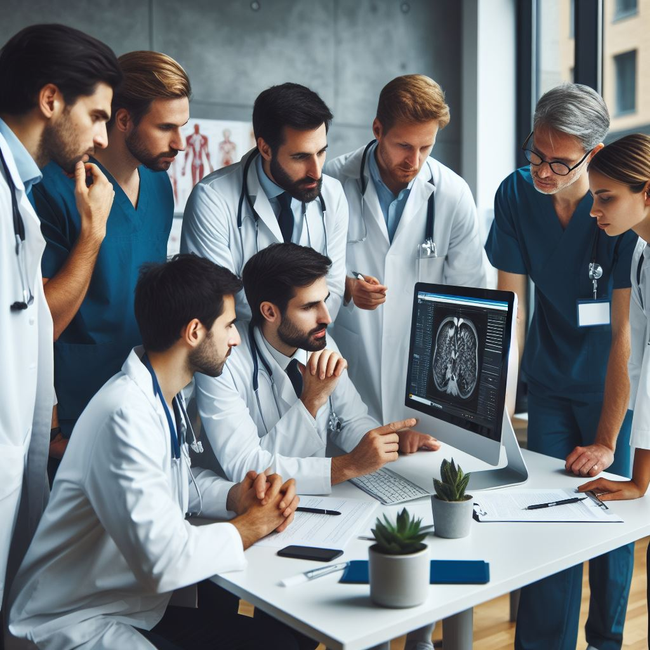 Image Credit: Ben Finio / Science Buddies
Artificial intelligence (AI) programs can generate text and images based on their training data. They "learn" from millions of pages of text and images scraped from the internet, and use that information to generate new text and images based on prompts given by human users. However, this means that AI can be vulnerable to biases that are built-in to the training data. For example, if the training images of doctors disproportionately show white men, an AI trained on the images may also disproportionately produce images of white men. Over-correcting for this can also cause problems, such as generating historically inaccurate images.
In this project, you will generate your own AI images and compare your results to actual employment data from the government. Do you think AI image generation programs accurately reflect the real-world demographic distribution of people in various professions?
Terms and Concepts
- Generative artificial intelligence
- Prompt
- Training data
- Bias
Questions
- What are some of the societal risks and benefits of generative AI?
- How can biases in training data show up in the content produced by generative AI?
Bibliography
- Artificial intelligence is a rapidly changing field. You should do research for current news articles and recent publications about bias in AI.
- The US Census Bureau and the US Bureau of Labor Statistics (BLS) are both good sources for demographic and occupational information in the United States. You will need to look up the most recent available information when you do this project (data may typically lag by one or more years). You can search for data with a Google search or directly on the Census or BLS websites. Try searching for data tables with search queries like "occupation by race and gender."
Materials and Equipment
- Computer with internet access
Experimental Procedure
- Choose at least one AI image generation service to test. You can also choose multiple programs/websites and compare their results. You will need to search online to find out what AI image-generation services are currently available. Note that some sites may limit the number of images you can generate with a free version.
- Choose at least 10 different careers to test. Make sure you can find current gender and racial data for those careers on either the US Census Bureau or Bureau of Labor Statistics websites (see Bibliography).
- Prepare a data table like Table 1. As needed, add columns for additional races/genders and rows for additional AI sites/professions.
| Real-world gender percentages | Real-world race percentages | AI gender percentages | AI race percentages | ||||||||||||
|---|---|---|---|---|---|---|---|---|---|---|---|---|---|---|---|
| AI Site/Program | Profession | Male | Female | Other | Black | White | Asian | ... | Male | Female | Other | Black | White | Asian | ... |
Table 1. Example data table.
- Fill in the real-world demographic data for your chosen professions based on the data you found.
- Now, for each profession you chose, create 100 AI-generated images. Make sure you keep the prompt gender and race-neutral, such as "create a picture of a doctor."
- If you are using multiple AI sites/programs, create 100 images of each profession with each website. Keep the images organized so you do not lose track of which site you used to generate them.
- Enter the gender and race percentages for your AI-generated images in each row of your data table.
- Analyze your data.
- Make a scatter plot for gender with each profession as a data point.
- The x-axis should be the real-world percentage for that gender and the y-axis should be the AI-generated percentage.
- Gender data points that fall below a diagonal line with a slope = 1 are under-represented by the AI program (the AI percentage of that gender is lower than the real-world percentage of that gender). Data points above the line are over-represented.
- Where are data points for different professions relative to that diagonal line? Are some genders consistently under or over-represented? Does it vary by profession?
- Repeat step 8.a for race.
- If you tested multiple AI sites/programs, compare your results between them. Are the results the same? Are some sites better at accurate representation than others?
- Make a scatter plot for gender with each profession as a data point.
Ask an Expert
Variations
- Ask the AI to generate pictures of groups of people instead of a single person. Does this change your results at all?
- Change your prompts to specify race and/or gender. Does the AI accurately respond to your prompt?
- Ask the AI to generate pictures of people from a certain profession in a specific year, such as "a doctor from the year 1950." Compare your results to census/BLS data for that year. Do the results change based on the year?
Careers
If you like this project, you might enjoy exploring these related careers:


Related Links
- Science Fair Project Guide
- Other Ideas Like This
- Sociology Project Ideas
- Artificial Intelligence Project Ideas
- Human Behavior Project Ideas
- My Favorites
- Can Humans Recognize AI-Generated Images?
- Can Humans Recognize ChatGPT's AI-Generated Text?